176.38.220.73
Nåværende poeng: 7.9 (kun tjenere med en høyere poengsum enn 10 blir brukt i puljen)
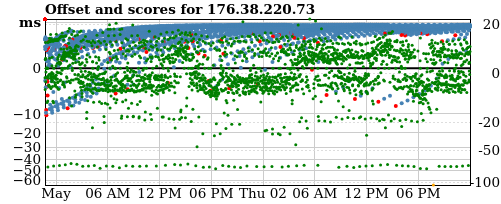
History
In the graph above the green, orange and red dots are offsets (in milliseconds, using the left axis).
The blue or red (bigger) dots are the
calculated scores (using the right axis).
Client distribution
The units are in permyriad (‱, 1/10000). "100" equals one percent of DNS queries from the specified country.
The countries are ordered by number of DNS queries answered with the server IP from this country. The second number is the servers permyriad of the overall "netspeed" for countries configured for the server. # 48699, CSV-logg Hva betyr grafene?